How to interpolate a curved line with non-increasing X

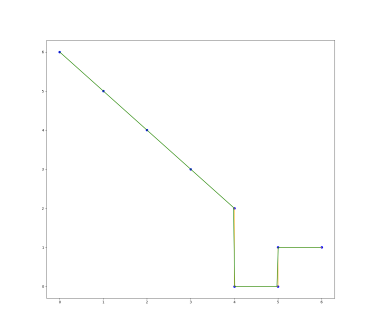
I have a line of x/y points, but the line at some point goes “straight down” (i.e. the x values don’t increase, but the y values do).

How can I interpolate (and plot) a curve of this line?

I tried using various methods, including CubicSpline, which raised this error:

# ValueError: `x` must be strictly increasing sequence.

The line I want to interpolate & plot is the red line, which I added with GIMP. It was not plotted by matplotlib.

learn-curve

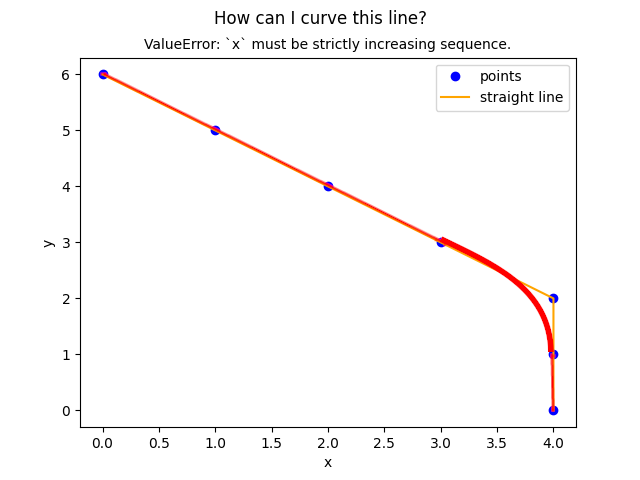
"""How can I curve this non-increasing x line?."""

import numpy as np
import matplotlib.pyplot as plt

from scipy.interpolate import CubicSpline  # type: ignore

# fmt: off
line = np.array( [ [0, 6], [1, 5], [2, 4], [3, 3], [4, 2], [4, 1], [4, 0], ])
# fmt: on

x = line[:, 0]
y = line[:, 1]

# Plotting the original points
plt.plot(x, y, "o", label="points", color="blue")
plt.plot(x, y, "-", label="straight line", color="orange")

failure_exn = None

# Upscaling and executing cubic spline fails due to
# ValueError: `x` must be strictly increasing sequence.
try:
    upscale_factor = 64
    xnew = np.linspace(np.min(x), np.max(x), num=(len(x) * upscale_factor), endpoint=True)
    spl = CubicSpline(x, y)
    ynew = spl(xnew)
    plt.plot(xnew, ynew, "-", label="spline", color="red")
except ValueError as e:
    failure_exn = e

plt.legend()
plt.suptitle("How can I curve this line?")
plt.title("ValueError: `x` must be strictly increasing sequence.", fontsize="medium")
plt.xlabel("x")
plt.ylabel("y")
plt.savefig("learn-curve.png")

# Throw after plotting original points
if failure_exn:
    raise failure_exn

​​

2 Likes

If you have exact breaks like these, you can compute where they are, fit the segments in between, and use numpy.piecewise to represent them. You can also calculate the boundaries looking at \Delta x, or at dx/dy.

1 Like

Thanks @stefanv! Any chance you can provide a working example of your solution in code?

1 Like

This is a terrible implementation, but it gives the rough sketch:

import itertools

import numpy as np
import matplotlib.pyplot as plt
import scipy as sp


# https://docs.python.org/3.8/library/itertools.html#itertools-recipes
def pairwise(iterable):
    "s -> (s0, s1), (s1, s2), (s2, s3), ..."
    a, b = itertools.tee(iterable)
    next(b, None)
    return zip(a, b)


line = np.array([[0, 6], [1, 5], [2, 4], [3, 3], [4, 2], [4, 1], [4, 0], [5, 0], [5, 1], [6, 1]])

x = line[:, 0]
y = line[:, 1]

# Remove runs; you probably need something smarter here
dupe_mask = (x[:-2] == x[1:-1]) & (x[1:-1] == x[2:])
dupe_mask = np.hstack(([False], dupe_mask, [False]))

x = x[~dupe_mask]
y = y[~dupe_mask]

plt.plot(x, y, "o", label="points", color="blue")
plt.plot(x, y, "-", label="straight line", color="orange")

d = np.diff(x)
intervals_ix, = np.where(d == 0)
intervals_ix += 1
if intervals_ix[0] != 0:
    intervals_ix = np.hstack((0, intervals_ix))

N = len(x)
if intervals_ix[-1] != N:
    intervals_ix = np.hstack((intervals_ix, N))

print(list((x[a:b], y[a:b]) for a, b in pairwise(intervals_ix)))
polys = [sp.interpolate.CubicSpline(x[a:b], y[a:b]) for a, b in pairwise(intervals_ix)]
intervals = [(x[a], x[b - 1]) for a, b in pairwise(intervals_ix)]

def piecewise(x):
    # This is a very inefficient implementation; can be made much faster
    # especially if x is known to be sorted. In that case, break x up
    # into intervals, then do one evaluation per interval.
    for i, (a, b) in enumerate(intervals):
        if (x >= a) and (x < b):
            return polys[i](x)
    return np.nan

x_lin = np.linspace(0, 6, 200)
plt.plot(x_lin, [piecewise(e) for e in x_lin], color="green")
plt.show()

piecewise-poly-small

1 Like

Can also do:

xx = np.linspace(0, 6, 200)
yy = np.piecewise(xx, [((xx >= a) & (xx < b)) for (a, b) in intervals], polys)
plt.plot(xx, yy, color="green")

But then you need a copy of the condition mask for each polynomial; not great either.

1 Like

You could try splprep:

In [21]: tck1, u1 = splprep([x, y], s=0, k=1)

In [22]: uu1 = np.linspace(u1[0], u1[-1], 101)

In [23]: plt.plot(*splev(uu1, tck1), '--')
Out[23]: [<matplotlib.lines.Line2D at 0x7fa5b462d4b0>]

This works with a parametric curve, thus sidesteps the fact that y(x) is not single-valued.

1 Like

Thank you! Yes splprep(s=1, k=5) worked!

However, it still took some munging. I had to

  1. Identify the turning point e.g. [4, 2] and remove it from the array before splprep
  2. The tail of the array went all wobbly, so I cut that off and replaced it with a straight line.

Very much appreciated. Thanks again!

1 Like