Hello everyone,
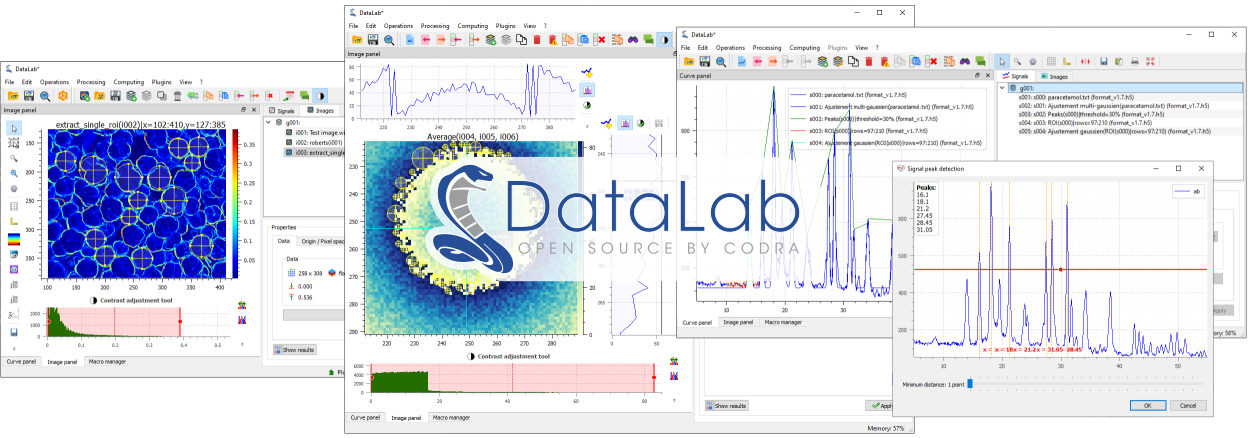
We’re excited to announce the release of DataLab v0.11, alongside a completely redesigned website.
Once again, this release is the result of the feedback and contributions of our early adopters. We’re grateful for your support and look forward to your continued insights.
![]() New Features:
New Features:
-
Enhanced tree view for signals and images with drag and drop functionality.
-
Advanced 1D interpolation and resampling features for signals.
-
New intensity profile features for images (e.g. radial profile).
-
Plot results obtained from signal and image computations.
-
And many other improvements (plugin API, 1D/2D computing results, profile extraction, …)
![]() Revamped Website:
Revamped Website:
-
Comprehensive documentation of features and public API.
-
“Getting Started” guides with overviews, use cases, and detailed tutorials, including videos (example data sets are mainly based on contributions from our early adopters).
![]() You have a project or a use case in mind? (we can even write a tutorial for you…) You want to contribute? We’d love to hear from you!
You have a project or a use case in mind? (we can even write a tutorial for you…) You want to contribute? We’d love to hear from you!
So please, don’t hesitate to contact us or to open an issue on our GitHub project for any request or question.
Join us in exploring these new advancements in DataLab v0.11 and utilize the wealth of resources available on our new website. Your journey in signal and image processing is about to get even more exciting!
Thank you for taking the time to read my announcement. Looking forward to your thoughts.
Best,
Pierre Raybaut