Hi all, I’m thinking about co-authoring SPEC for accessibility! I’ll be focusing on my experience with NumPy, and Isabela will talk about hers later. We’re starting with this opening post so that everyone can add their input and questions!
First, what is accessibility? Accessibility is about making technology accessible to the full range of human experience, which includes disabilities. The rest of this post will focus on implementing accessibility. If you’d like deeper dive into what accessibility means for NumPy specifically, watch out for an upcoming blog post.
In my experience, there are three big problems in implementing accessible technology:
- Information overload
- Accessing the scope
- Individual tweaks for each project
1) Information Overload
The guidelines most referred to are set by W3, the ‘Web Accessibility Initiative of the World Wide Web Consortium’, the main international standards organization for the Internet. It is primarily focused on web pages, but there are many applicable guidelines for non-web UX/UI interfaces as well.
There are three ‘levels’ we can achieve in each area.
In this example, there are different contrast ratios between text and the page background color. A greater contrast ratio helps people with visual disabilities better read text.
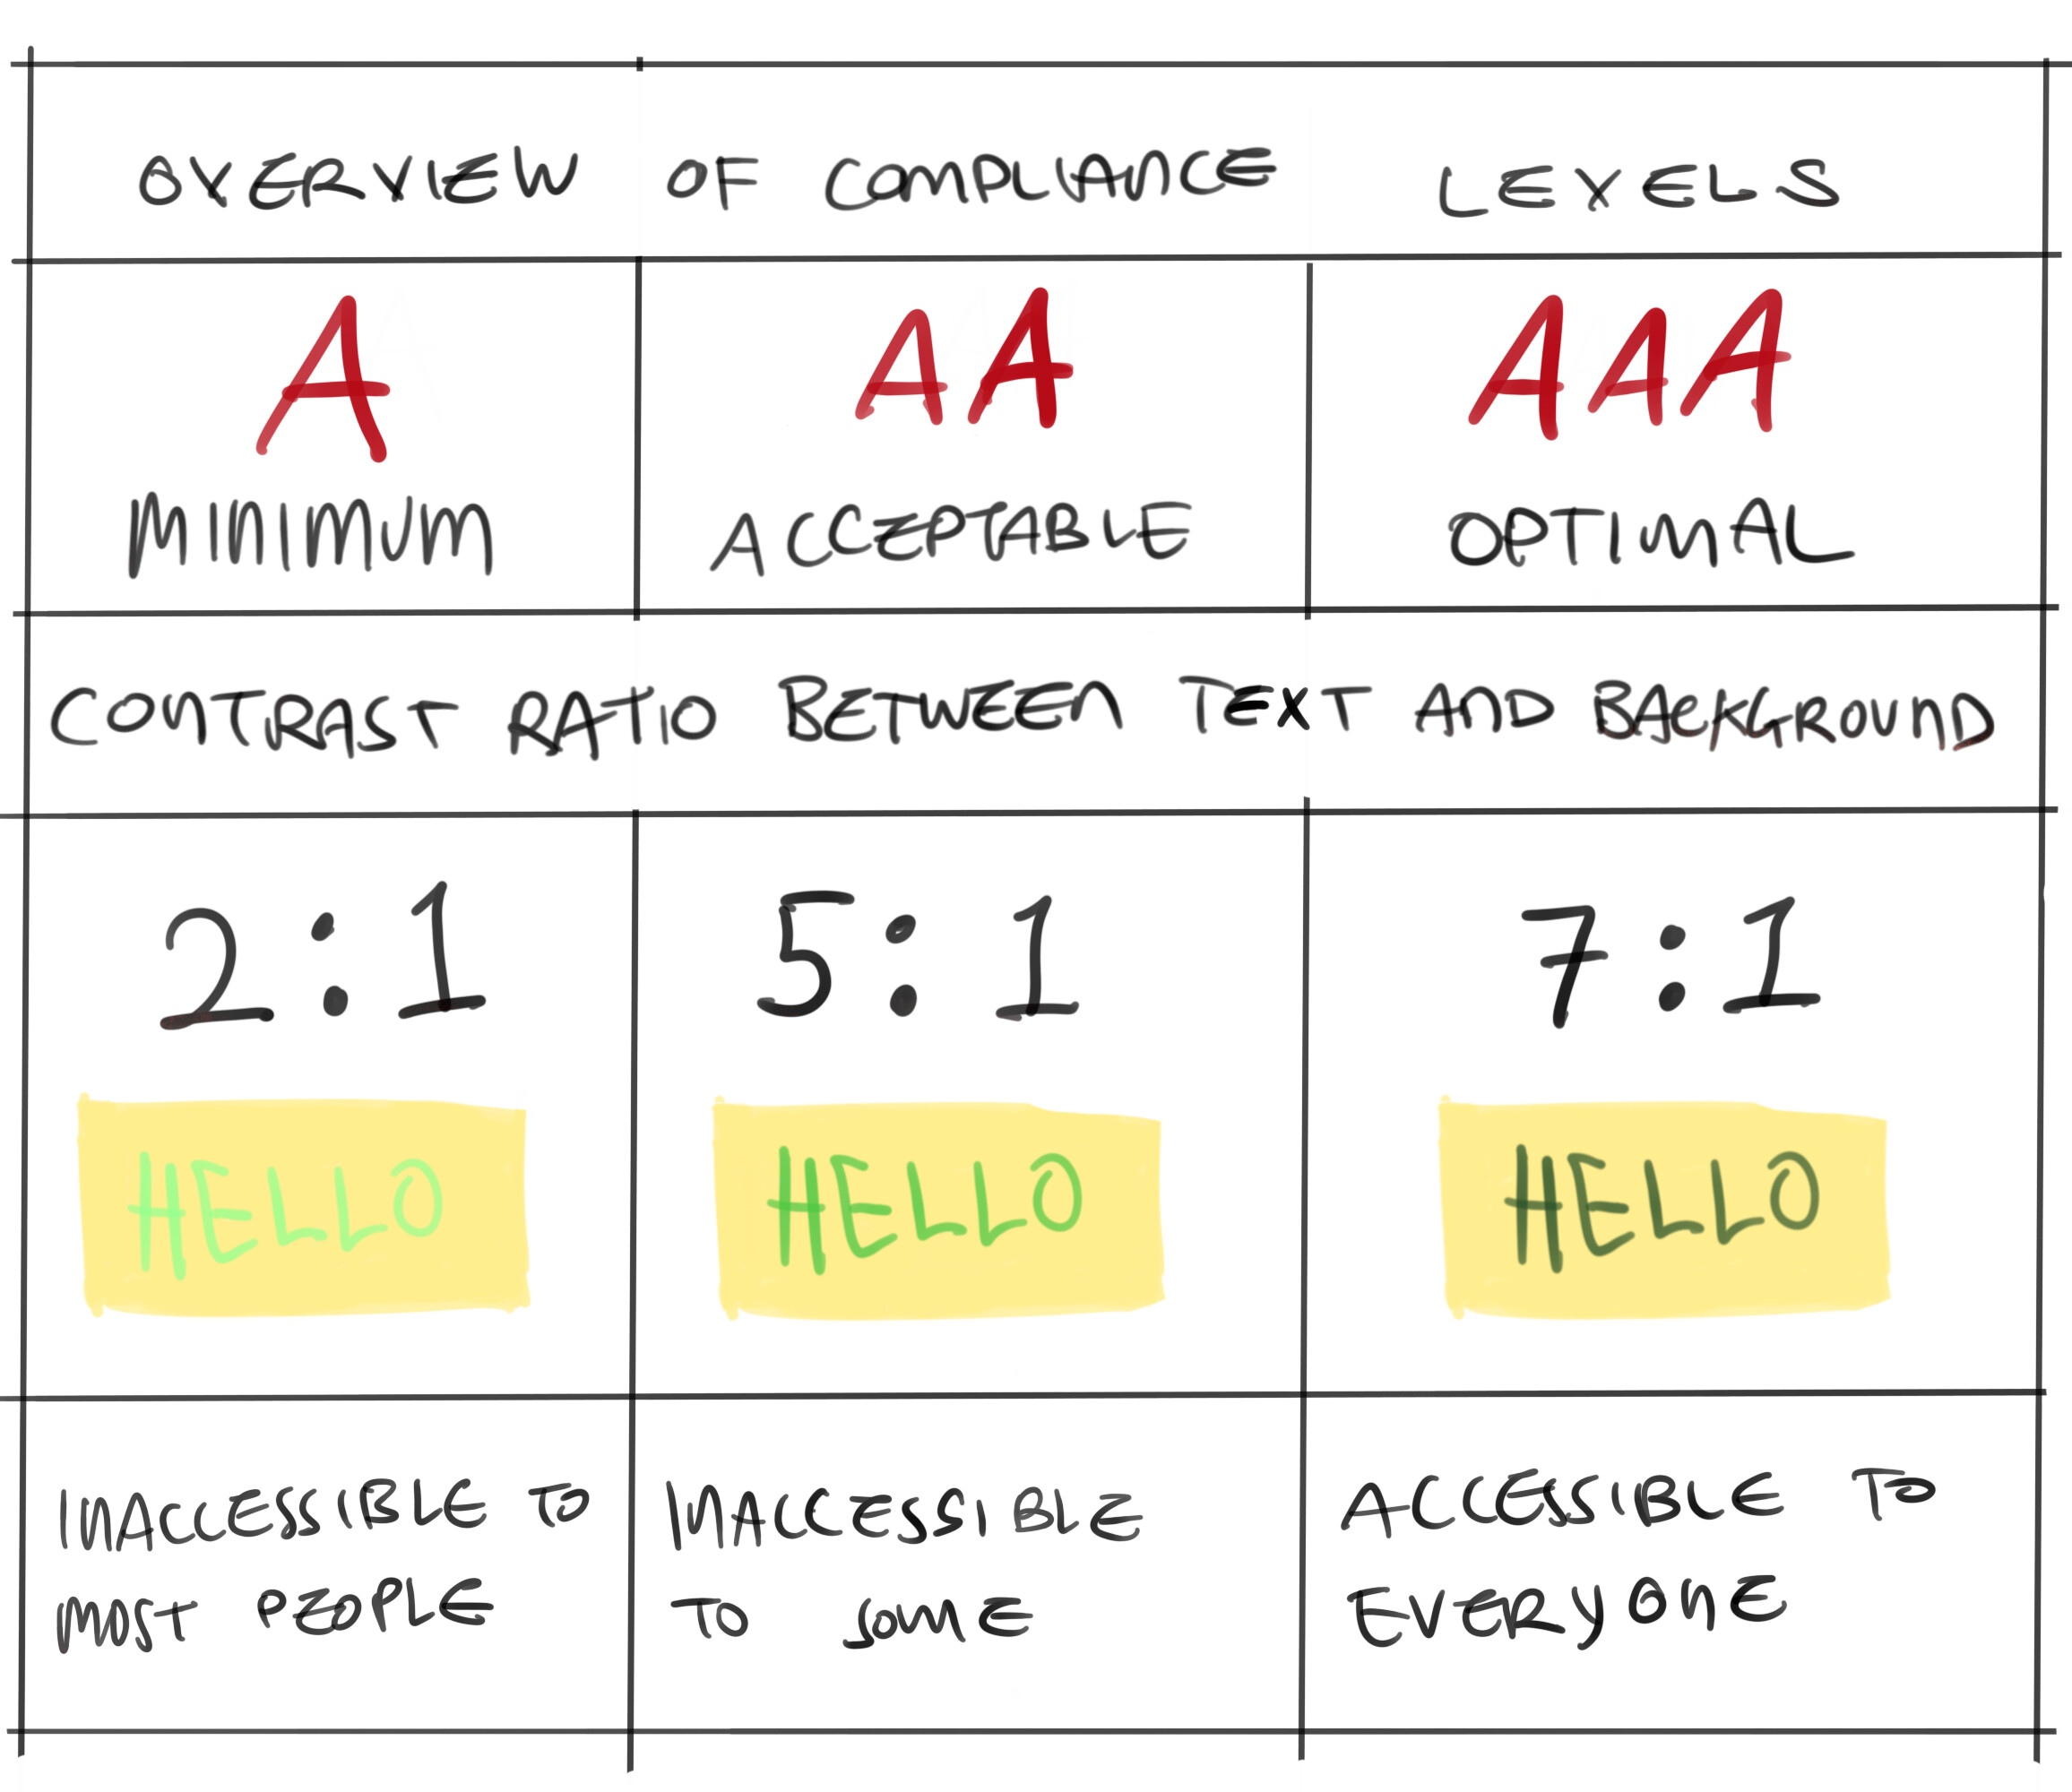
People without visual disabilities are also probably struggling to read the first example with 2:1 contrast ratio!
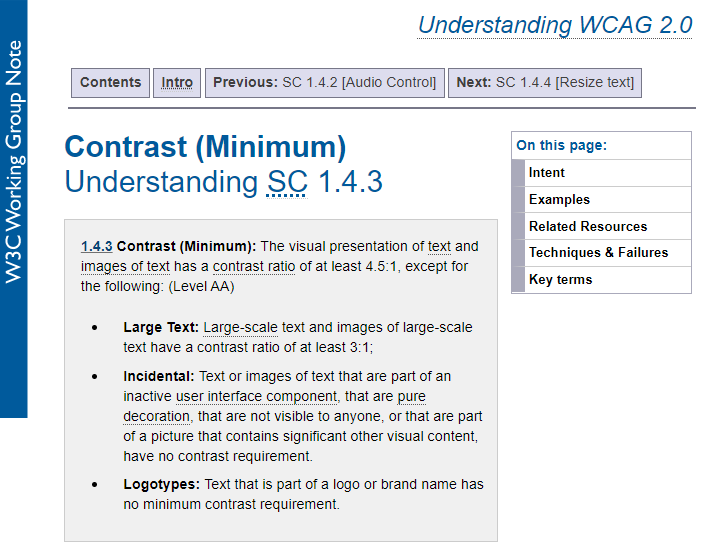
This seems like a simple fix- change the color of the text! However, if you wish to understand more, upon opening the W3 page for visual contrast, it’s easy to feel overwhelmed.
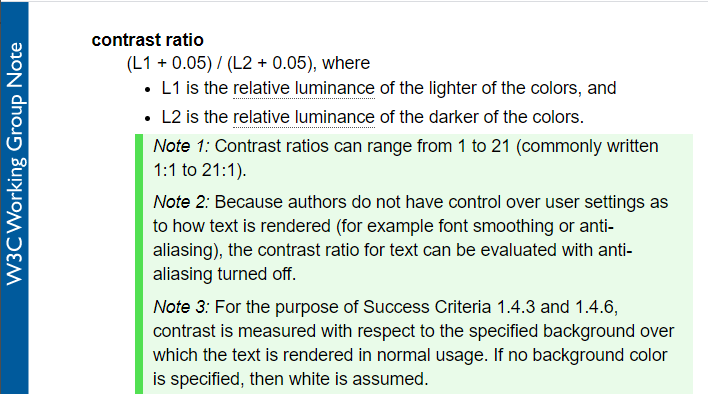
Scrolling down the page, the Key Term section is very extensive. There are many details, numbers and new terms such as ‘relative luminance’.
However this high level of detail is suitable for this page, as this page would be equivalent to reference documentation. It is purposely extensive as it contains guidelines on how to fulfill nearly every occurrence of text on a page.
For more visual examples and less jargon-filled explanation, we can refer to resources that are not from W3, but closely refer to the W3 guidelines. One example would be from WebAIM.
Here is the WebAIM page for visual contrast.

WebAIM still refers to the ‘relative luminance’ guidelines, but begins in a more familiar way, focusing on webpage text styling.
By referring to these guidelines, we can start to access the scope and understand where our projects are falling short.
2) Accessing the Scope
There are a variety of ways to access our projects. There are automated tools, manual testing, CI testing, paying for audits and asking disabled users for their feedback. Factors include time, cost and human cost.
There is a good, quick-glance review every project can make right now. Using an automated accessibility tool, we can to get a tally and grouping of the met and unmet guidelines for your project’s web page.
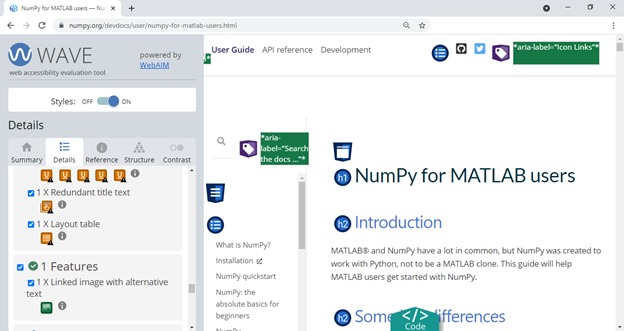
In the above example, we used the WAVE tool, provided by the above-mentioned WebAIM. We put in numpy.org into this page. I’ve also used the WAVE browser extension to compare issues across the site.
These automated tools are great as a quick review. To get a more comprehensive and long-term review, projects can integrate CI testing such as with the open-source pa11y CI test. There are also many companies that provide audits for a fee. At this time, NumPy has not paid for an audit so I cannot comment or provide any recommendations.
3) Individual tweaks for each project
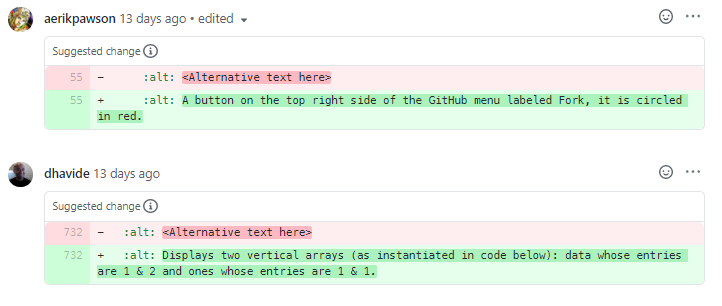
Each project has different needs and sometimes the standard guidelines aren’t sufficient. One example would be the guidelines on providing ‘alt-text’ for mathematical diagrams in the NumPy documentation.
The general guidelines for writing ‘alt-text’ is for visual, subject-based images.
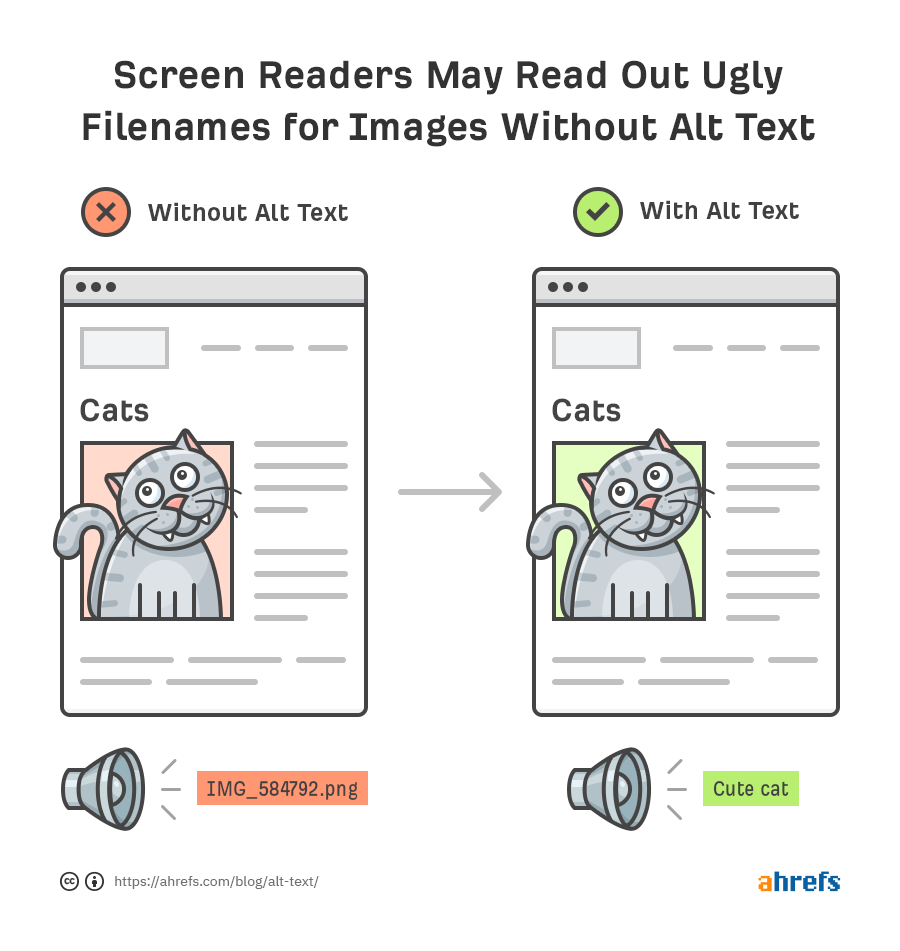
Most guidelines recommend only writing relevant information and being succinct, usually less than 120 characters in total.
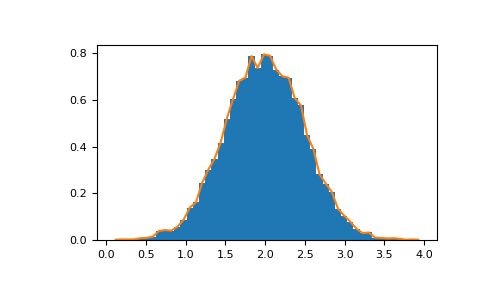
However, what is ‘relevant information’ in this histogram made with NumPy and Matplotlib? Is it enough to say ‘A histogram’? ‘A bell-shaped histogram’? ‘A bell shaped histogram that peaks in the center’? Do I need to provide the X and Y axis variance? The number of bins? And how do I fit all this in 120 characters?
We had to do more digging for 1) guidelines for mathematical diagrams 2) alt-text that is longer than 120 characters.
After some more digging, we found an extremely useful resource, the Diagram Center which provides full examples for geographic maps, Venn-diagrams, chemistry and more. We looked their example for bar graphs, understand what would be considered relevant information and adjust it for histograms.
The second problem was that providing all the relevant information would take more than 120 characters. What do we do?
After doing some reading, we found out why 120 characters is recommended in the first place. It is not a hard limit. Instead, it is a courtesy to time of screen-reader users. A very long alt-text may be perfect when the user wants to dig into the information, but unnecessary when quickly scanning a page.
The solution we decided on was having a ‘short-description’ that summarized the overall trend in the diagram, and a separate, optional ‘long-description’ that a user can expand for the full details.
Short-description: A normalized histogram that peaks at (2.0, 0.8).
Long-description: A normalized histogram with 1000 normal deviates with a variance of 0.5^2 and mean 2. It has 50 bins. It is bell-shaped and centered in the middle of the X axis, peaking at (2.0, 0.8).
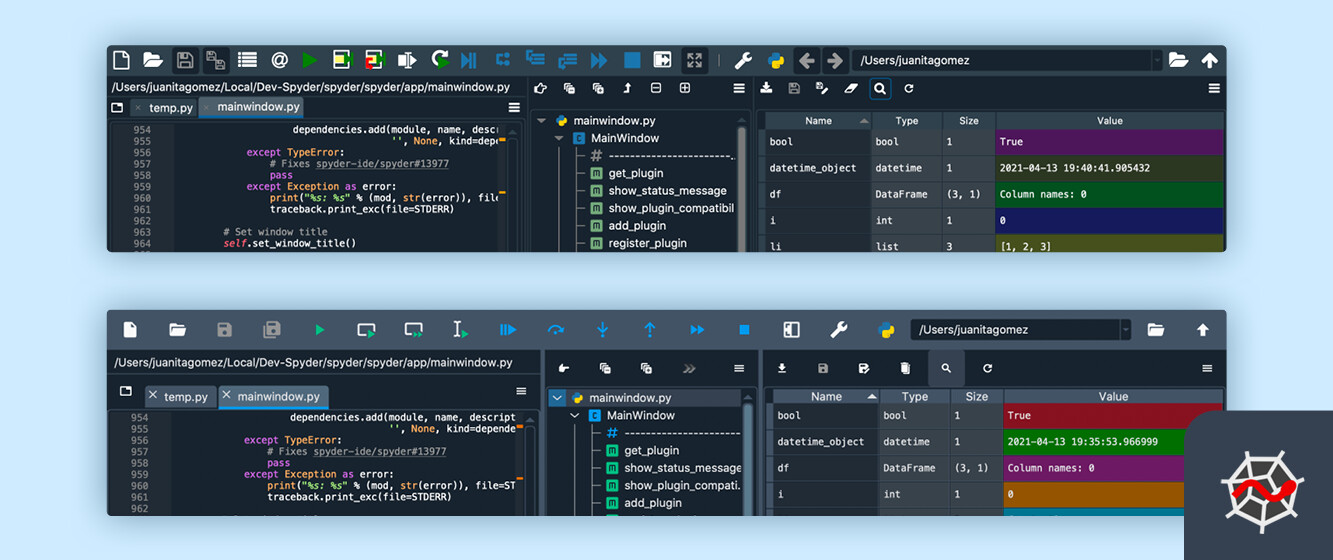
These tweaks are focused on documentation and web-pages, since NumPy is a library used inside a code editor. In comparison, Spyder is interfaced through its application interface.
One recent step forward Spyder did take was the recent UI/UX overhaul to Spyder 5, which included making clearer, consistent icons. UX/UI works in tandem with accessibility, as clearer interfaces reduce mental overhead and allow everyone to use the technology.
Understanding what a project needs require an understanding why guidelines exist, who they serve and the scope of what can be improved.
Similarities across all projects
Despite these differences, all projects can move towards more accessible
- websites
- documentation
- UX/UI where relevant
Some of these similarities can fixed all at once. For example, NumPy and Pandas both use the PyData Spinx Theme, which has some color-contrast issues.This has been reported upstream. Additionally, the PyData Spinx team is currently implementing CI testing, so that these issues can be flagged and corrected. This way, no-one is re-inventing the wheel- instead we all share a shiny new wheel!
Making the disabled community feel welcome
Open-source project are community-supported, and we need to honesty ask ourselves if we are sufficiently supporting the disabled community. Not just meeting guidelines, but creating a cultural shift.
Each project will best understand what approach to take. For NumPy, we want to create a culture where the disabled community feel welcomed, where they can see that a project is already taking the first step. I’ll expand on this approach in a blog post and post it here once it’s done.
Open to discussion
This is certainly not the final written SPEC. We learnt a lot from other projects, but I mostly covered NumPy here. Let us know of any other tools, audits, community approach, high-priority guidelines, quick fixes, etc.